Kibana is the name of a visualization tool for elasticsearch; it runs in your web browser. Kibana enables you to query and view records from your elasticsearch repository. It’s easy to host Kibana yourself or, as we are doing here, use a hosted version.
The data and query interface are the same as we saw in the reporting entry, of which we’ll see more detail when we get to elasticsearch.
Apache access hits
In this image we are viewing records where field _type==‘apache-access’ and timestamp is from now to 1 day ago (time filter not visible in image).
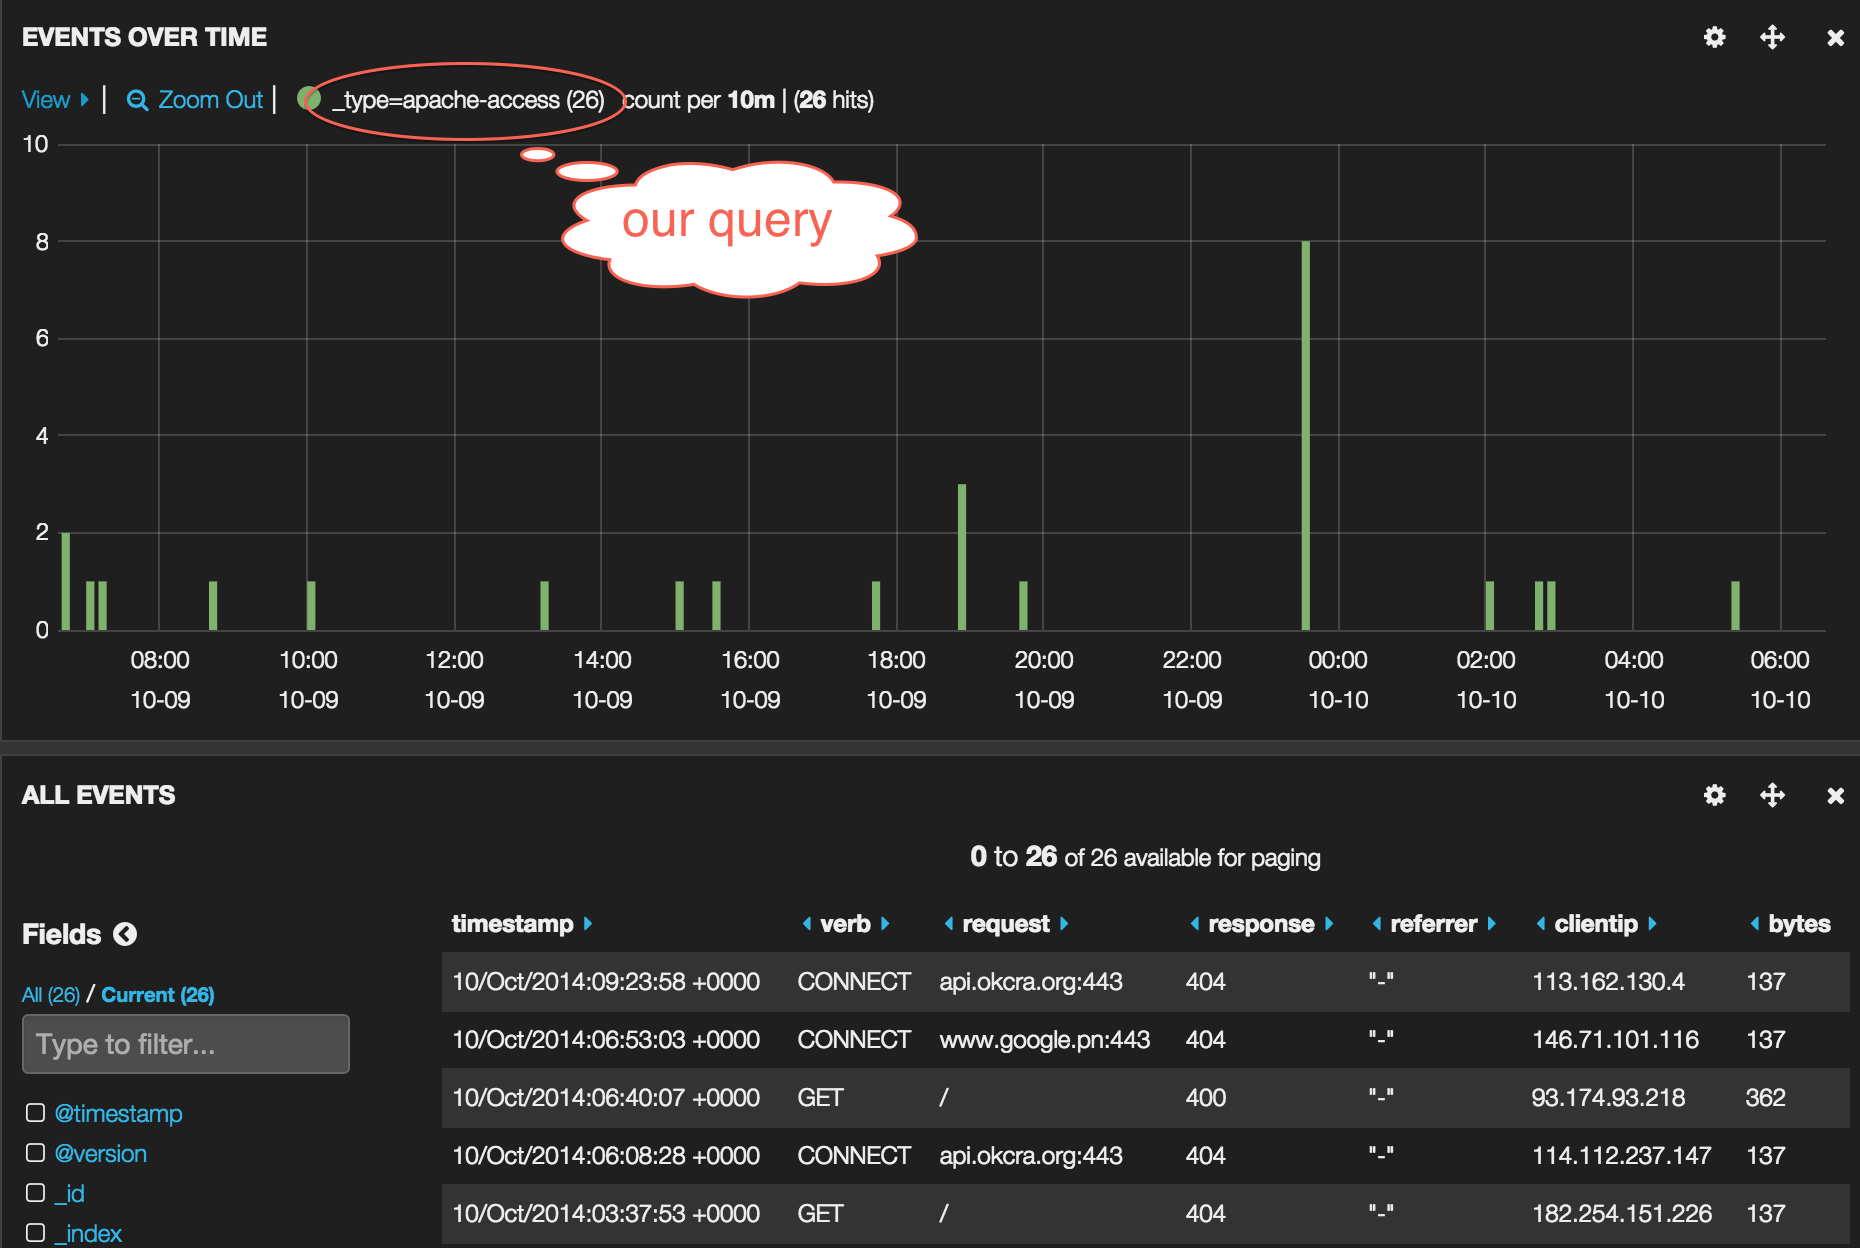
Recall the apache access logs were assigned the type ‘apache-access’ in the logstash config.
1 2 3 4 5 6 | |
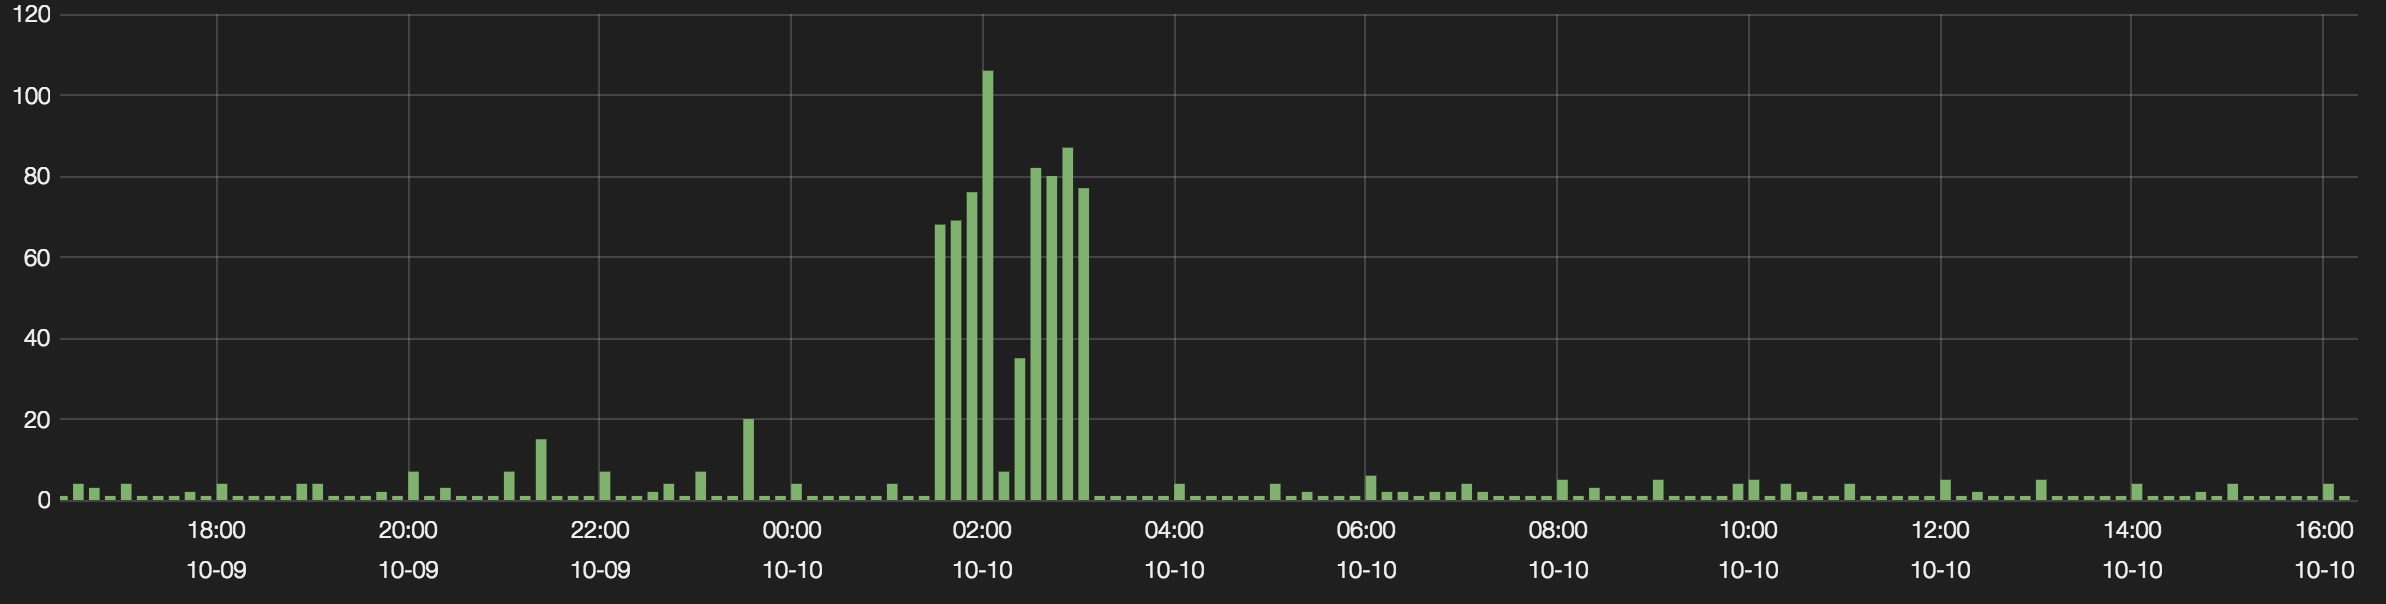
Some ssh probing
The tall bars are failed attempts to log in via ssh. Being aware of those sorts of activities is another advantage of centralized logging and reporting.