Now that our log records are stored and queryable by the logging service we’d like to make use of our data. We can generate reports about whatever interests us, be it usage patterns, errors, etc.
The log records can be parsed into discrete fields which can be indexed and subsequently searched and filtered using some exposed form of query. This is extremely valuable with distributed log sets.
For example I can ask to see all of yesterday’s apache access log entries for a particular application where the HTTP return code was >= 400, whether the application was running on one, a dozen, or a hundred servers.
This entry will explore Logsene’s reporting interface. We’ll also report on Logsene’s more obvious elastic search interfaces in later entries.
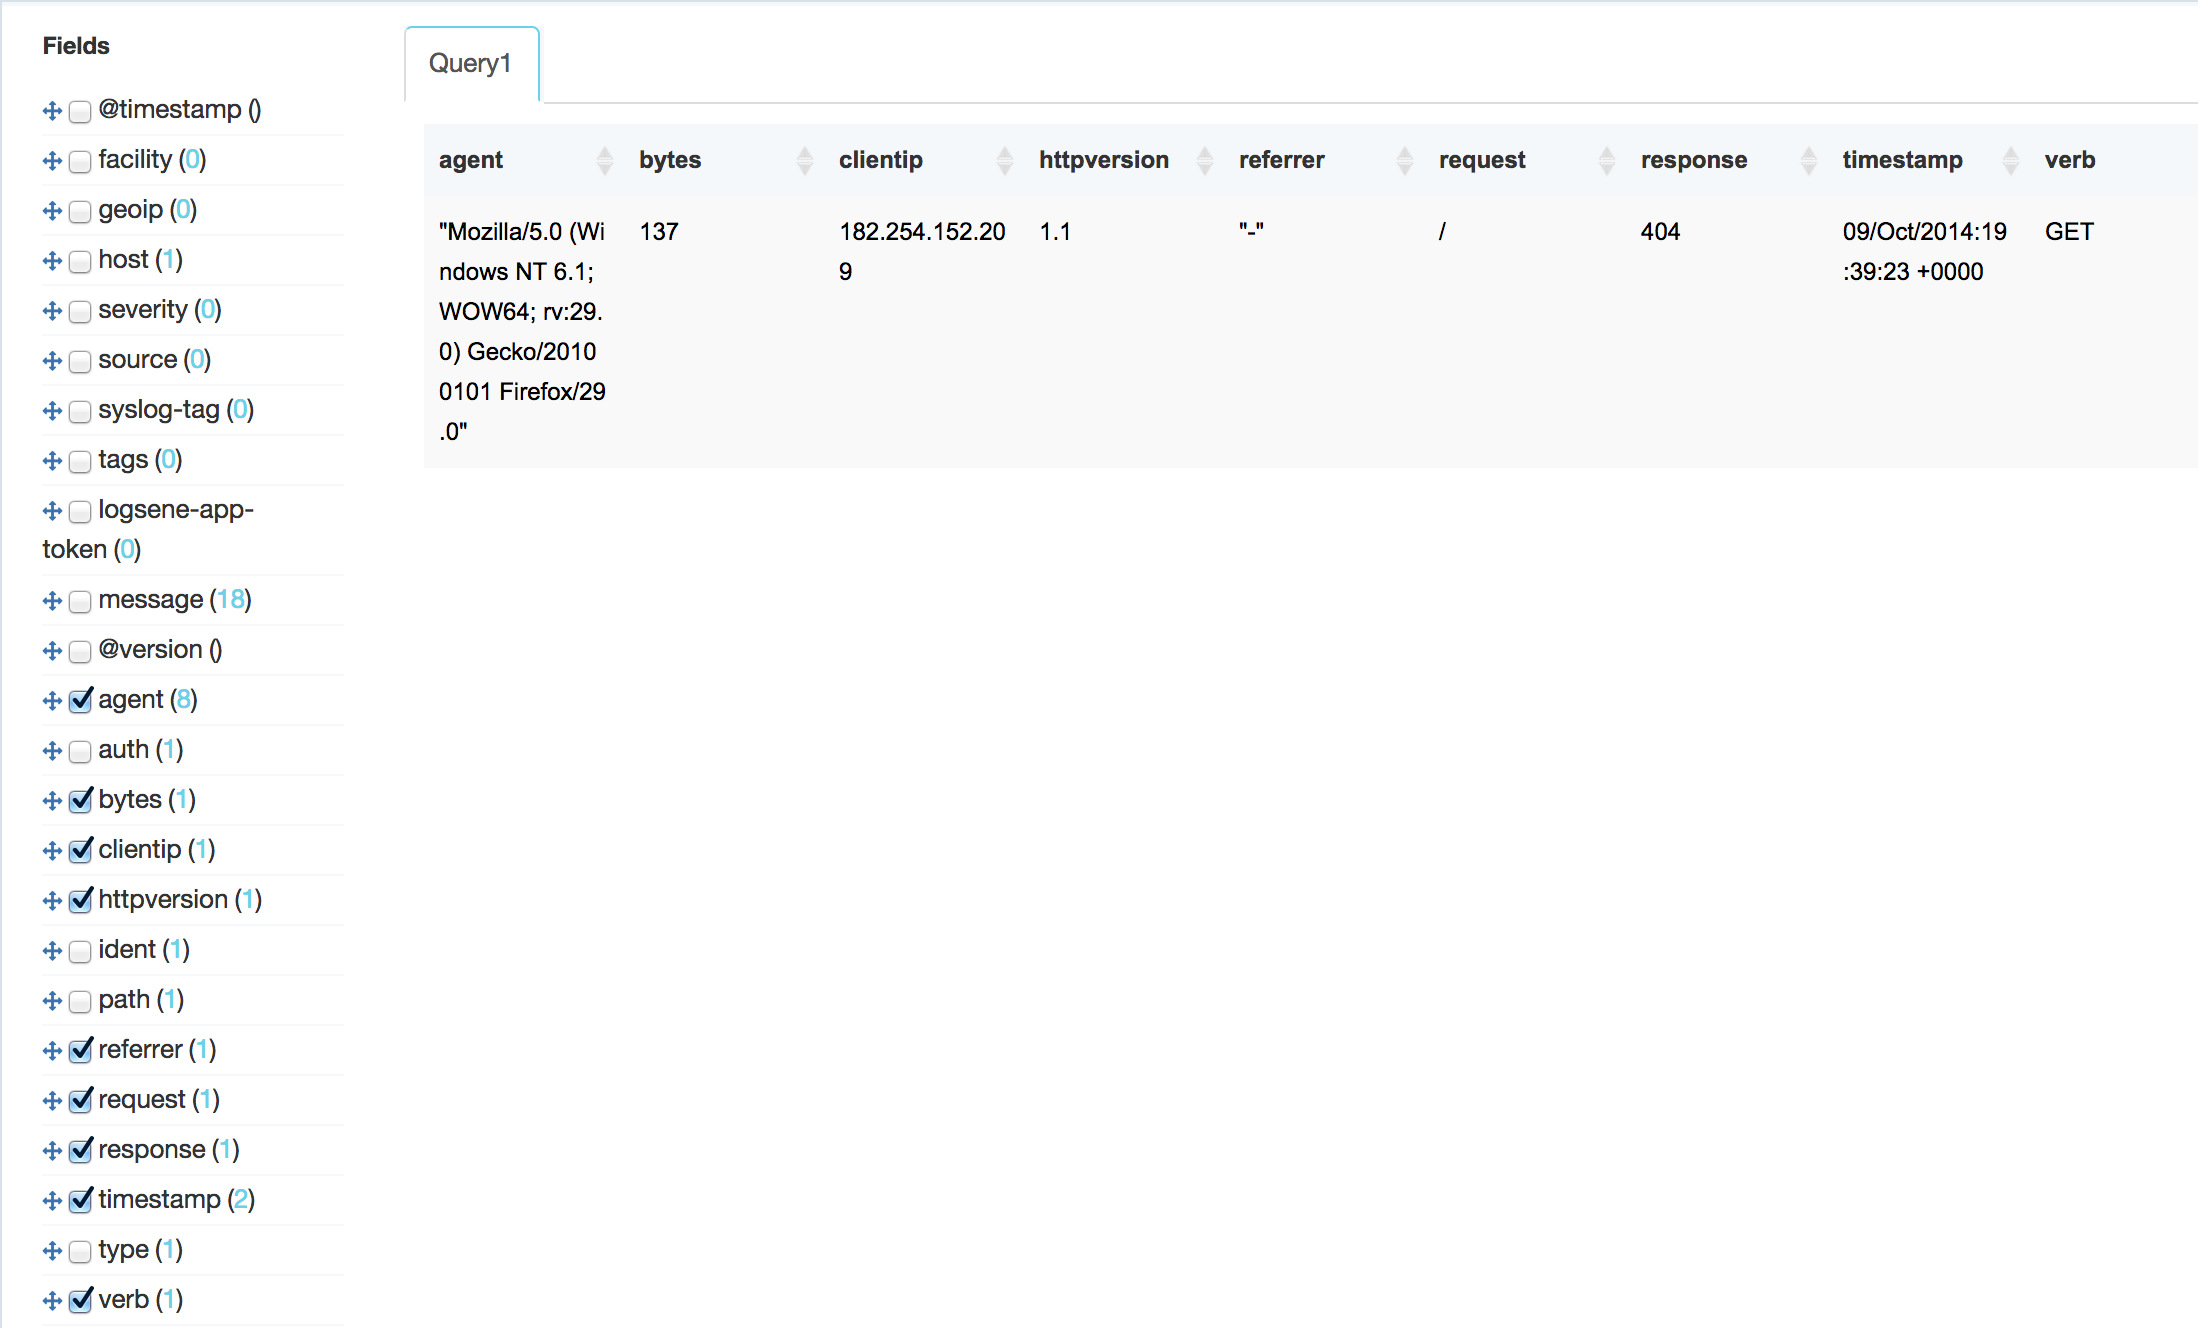
Logsene reporting web interface
The field names on the left of the page are parsed from incoming log entries. Some are system fields while others are log-specific. Our logs are apache access logs in the combined log format. That is, we specified our apache httpd server output using ‘LogFormat combined’ which is a known, common apache web server access log format.
Combined format is defined like this.
1
| |
where the fields are:
%h - IP address of client making request
%l - client identd
%u - user name
%t - time of request
%r - client request
%>s - HTTP response status code
%b - size, in bytes, of response
%Referer - HTTP header Referer value
%User-Agent - HTTP header User-Agent value
See (http://httpd.apache.org/docs/2.4/logs.html) for more info on apache httpd logging.
We are sending logs to logsene using logstash which parses the original log into JSON before sending to logsene.
Remember, we specified the log format in the logstash config file’s grok filter section.
1 2 3 4 5 6 7 8 | |
The ElasticSearch server automatically parses the JSON message, storing and indexing each field, making the fields available for queries and display.